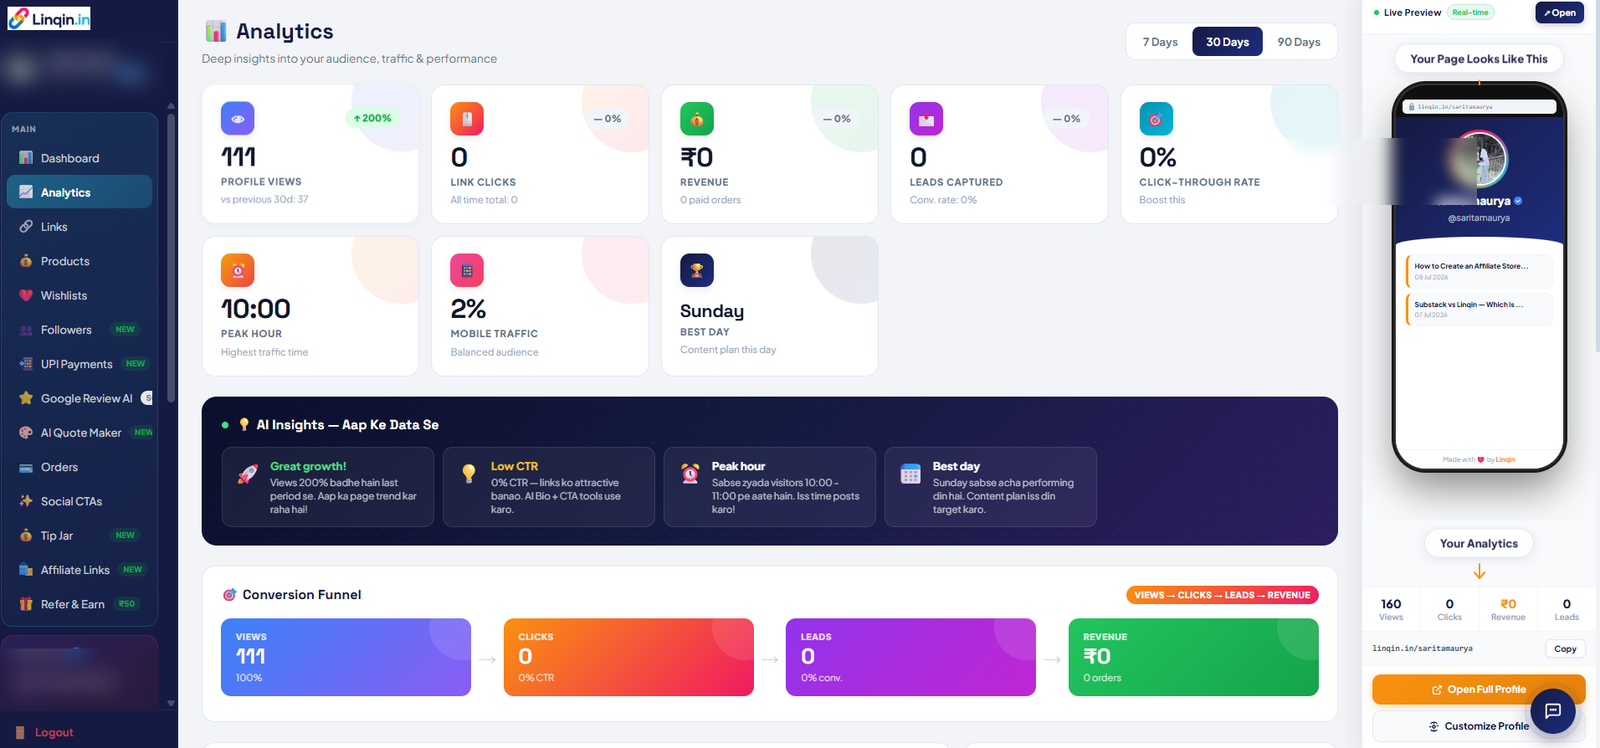
Views dekhna easy hai, lekin un views ke peeche kya ho raha hai? Linqin Analytics se creators apne page performance, clicks, audience activity, leads aur revenue ko ek jagah samajh sakte hain.
Linqin Analytics: Apne Audience Ko Samjho, Sirf Views Ko Nahi 📊
Profile views se lekar clicks, leads aur revenue tak — Linqin Analytics aapko ek hi dashboard mein apni page performance samajhne mein help karta hai.

Aap Instagram, YouTube, Pinterest ya kisi bhi social platform par regularly content post karte hain, to ek question almost hamesha aata hai: “Mere content ka actual result kya aa raha hai?”
Sirf followers count dekhna enough nahi hai. Agar 1,000 log aapki Linqin page dekh rahe hain, lekin koi link click nahi kar raha, product open nahi kar raha ya enquiry nahi bhej raha, to problem views mein nahi — conversion journey mein ho sakti hai.
Isi point par Linqin Analytics useful ho jata hai. Dashboard aapko ek place par important performance signals dikhata hai, jisse aap guesswork ke bajay data ke basis par apni content strategy improve kar sakte hain.
📊 Linqin Analytics Actually Kya Track Karta Hai?
Dashboard ka main purpose simple hai: visitor kya kar raha hai aur aapki page kitni effectively kaam kar rahi hai?
Analytics section mein aapko profile views, link clicks, revenue, leads captured aur click-through rate jaise key numbers milte hain. Saath hi peak hour, mobile traffic aur best day jaise insights aapko timing aur audience behaviour samajhne mein help karte hain.
Kitne visitors aapki page par aaye.
Visitors ne kitne links click kiye.
Page se generated revenue ka signal.
Kitne potential customers capture hue.
👀 Profile Views: Attention Mil Rahi Hai Ya Nahi?
Profile Views sabse basic metric lag sakta hai, lekin creator ke liye ye bahut important starting point hai.
Agar views continuously increase ho rahe hain, iska matlab aapke social posts, bio link, content ya promotions logon ko Linqin page tak la rahe hain. Lekin yahan ek important lesson hai: high views automatically high income nahi hota.
Views ko hamesha clicks aur conversions ke saath compare karein.
🔗 Link Clicks: Audience Actually Kya Chahti Hai?
Suppose aapke paas 1,000 page views aaye, lekin sirf 20 clicks mile. Ye aapko ek useful signal deta hai.
Ho sakta hai CTA weak ho, link ka title clear na ho, ya visitor ko immediately samajh nahi aa raha ho ki click karne ke baad usse kya milega.
Isi liye Linqin page par links ko simple, specific aur action-oriented rakhna useful hai. “My Stuff” ke comparison mein “Download Free Ebook” ya “Book a Consultation” zyada clear CTA ho sakta hai.
🎯 Click-Through Rate (CTR): Views Se Action Tak
CTR basically ye samajhne mein help karta hai ki page dekhne wale visitors mein se kitne log next action le rahe hain.
Agar views high hain but CTR low hai, to page ko blindly promote karne ke bajay CTA, link order, headline, offer aur page design test karna zyada sensible hai.
⏰ Peak Hour: Content Kab Post Karna Chahiye?
Linqin Analytics mein Peak Hour jaise insights creator ko timing samajhne mein help karte hain. Screenshot mein example ke taur par 10:00 ka peak hour dikh raha hai.
Iska practical use kya hai? Agar aap notice karte hain ki audience ek particular time window mein zyada active hai, to important content, product launch ya CTA ko us period ke around test kiya ja sakta hai.
Ye “magic posting time” nahi hai. Isse ek starting point for testing samjhein.
📅 Best Day: Audience Kaunsa Din Better Respond Karti Hai?
Best Day aapko weekly behaviour ka ek quick signal deta hai. Agar kisi particular day par visitors ya engagement better perform kar raha hai, to us din stronger content ya important offer test kiya ja sakta hai.
📱 Mobile Traffic: Audience Phone Se Aa Rahi Hai?
Creators ki audience ka large portion mobile par ho sakta hai. Isliye Mobile Traffic dekhna useful hai.
Agar mobile traffic high hai, to aapki Linqin page ko phone screen par extremely easy-to-use hona chahiye: readable buttons, short labels, fast-loading visuals aur clear CTA.
🤖 AI Insights: Data Ko Simple Language Mein Samjho
Dashboard ka AI Insights section raw numbers ko practical observations mein convert karne ki direction mein help karta hai. Example ke taur par dashboard “Great growth”, “Low CTR”, “Peak hour” aur “Best day” jaise cards show karta hai.
Ye especially useful hai jab aap analytics expert nahi hain. Aapko har number ka technical meaning manually decode karne ke bajay ek quick interpretation mil sakti hai.
🚀 Conversion Funnel: Sabse Important Part?
Agar aap Linqin ko sirf links share karne ke liye use kar rahe hain, to analytics ka full potential miss ho sakta hai.
Conversion Funnel aapko journey ko simple sequence mein dekhne deta hai:
Ye sequence ek creator ko ye samajhne mein help karta hai ki problem exactly kahan hai. Views kam hain? Discovery improve karo. Clicks kam hain? CTA test karo. Leads kam hain? Offer aur landing experience dekho. Revenue kam hai? Product, pricing ya conversion journey analyze karo.
💡 Linqin Analytics Ko Smartly Kaise Use Karein?
- Weekly numbers compare karein — ek single day ke data par decision mat lein.
- Views ke saath clicks dekhein — traffic aur intent ko together samjhein.
- Low CTR par experiment karein — CTA, link title aur page order test karein.
- Peak hour ko test karein — important posts ko high-activity window mein publish karke compare karein.
- Conversion funnel dekhein — sirf vanity metrics ke peeche na bhaagein.
- Revenue ko final business metric samjhein — goal sirf views badhana nahi, relevant action generate karna hai.
Final Takeaway
Linqin Analytics ka real value sirf numbers dikhane mein nahi hai. Iska benefit tab milta hai jab aap numbers ko better decisions mein convert karte hain.
Profile views batate hain ki attention aa rahi hai. Link clicks interest ka signal dete hain. CTR page effectiveness samajhne mein help karta hai. Peak hour aur best day timing ko test karne ka direction dete hain. Leads aur revenue batate hain ki audience activity business result mein convert ho rahi hai ya nahi.
Simple words mein: guess mat karo — data dekho, test karo aur improve karo. 📊🚀
Ready to understand your audience better?
Linqin par apni creator page ko track karo aur dekho ki views se clicks, leads aur revenue tak journey kaisi perform kar rahi hai.
